Every revenue channel has a period where it is underpriced, underexploited, or not yet saturated. Whoever finds that window first gets an advantage, whoever executes it better turns the advantage into revenue, and whoever systemises it makes the whole thing repeatable. Traders have had a word for this for a long time, and alpha turns out to be the most useful way to think about gtm as well.
Every revenue channel has a period where it is underpriced, underexploited, or not yet saturated. The company that discovers that opportunity first gets an advantage. The company that executes it better turns the advantage into revenue. The company that systemises it makes it repeatable.
Traders have had a word for this for a long time, and it turns out to be the most useful way to think about gtm as well.
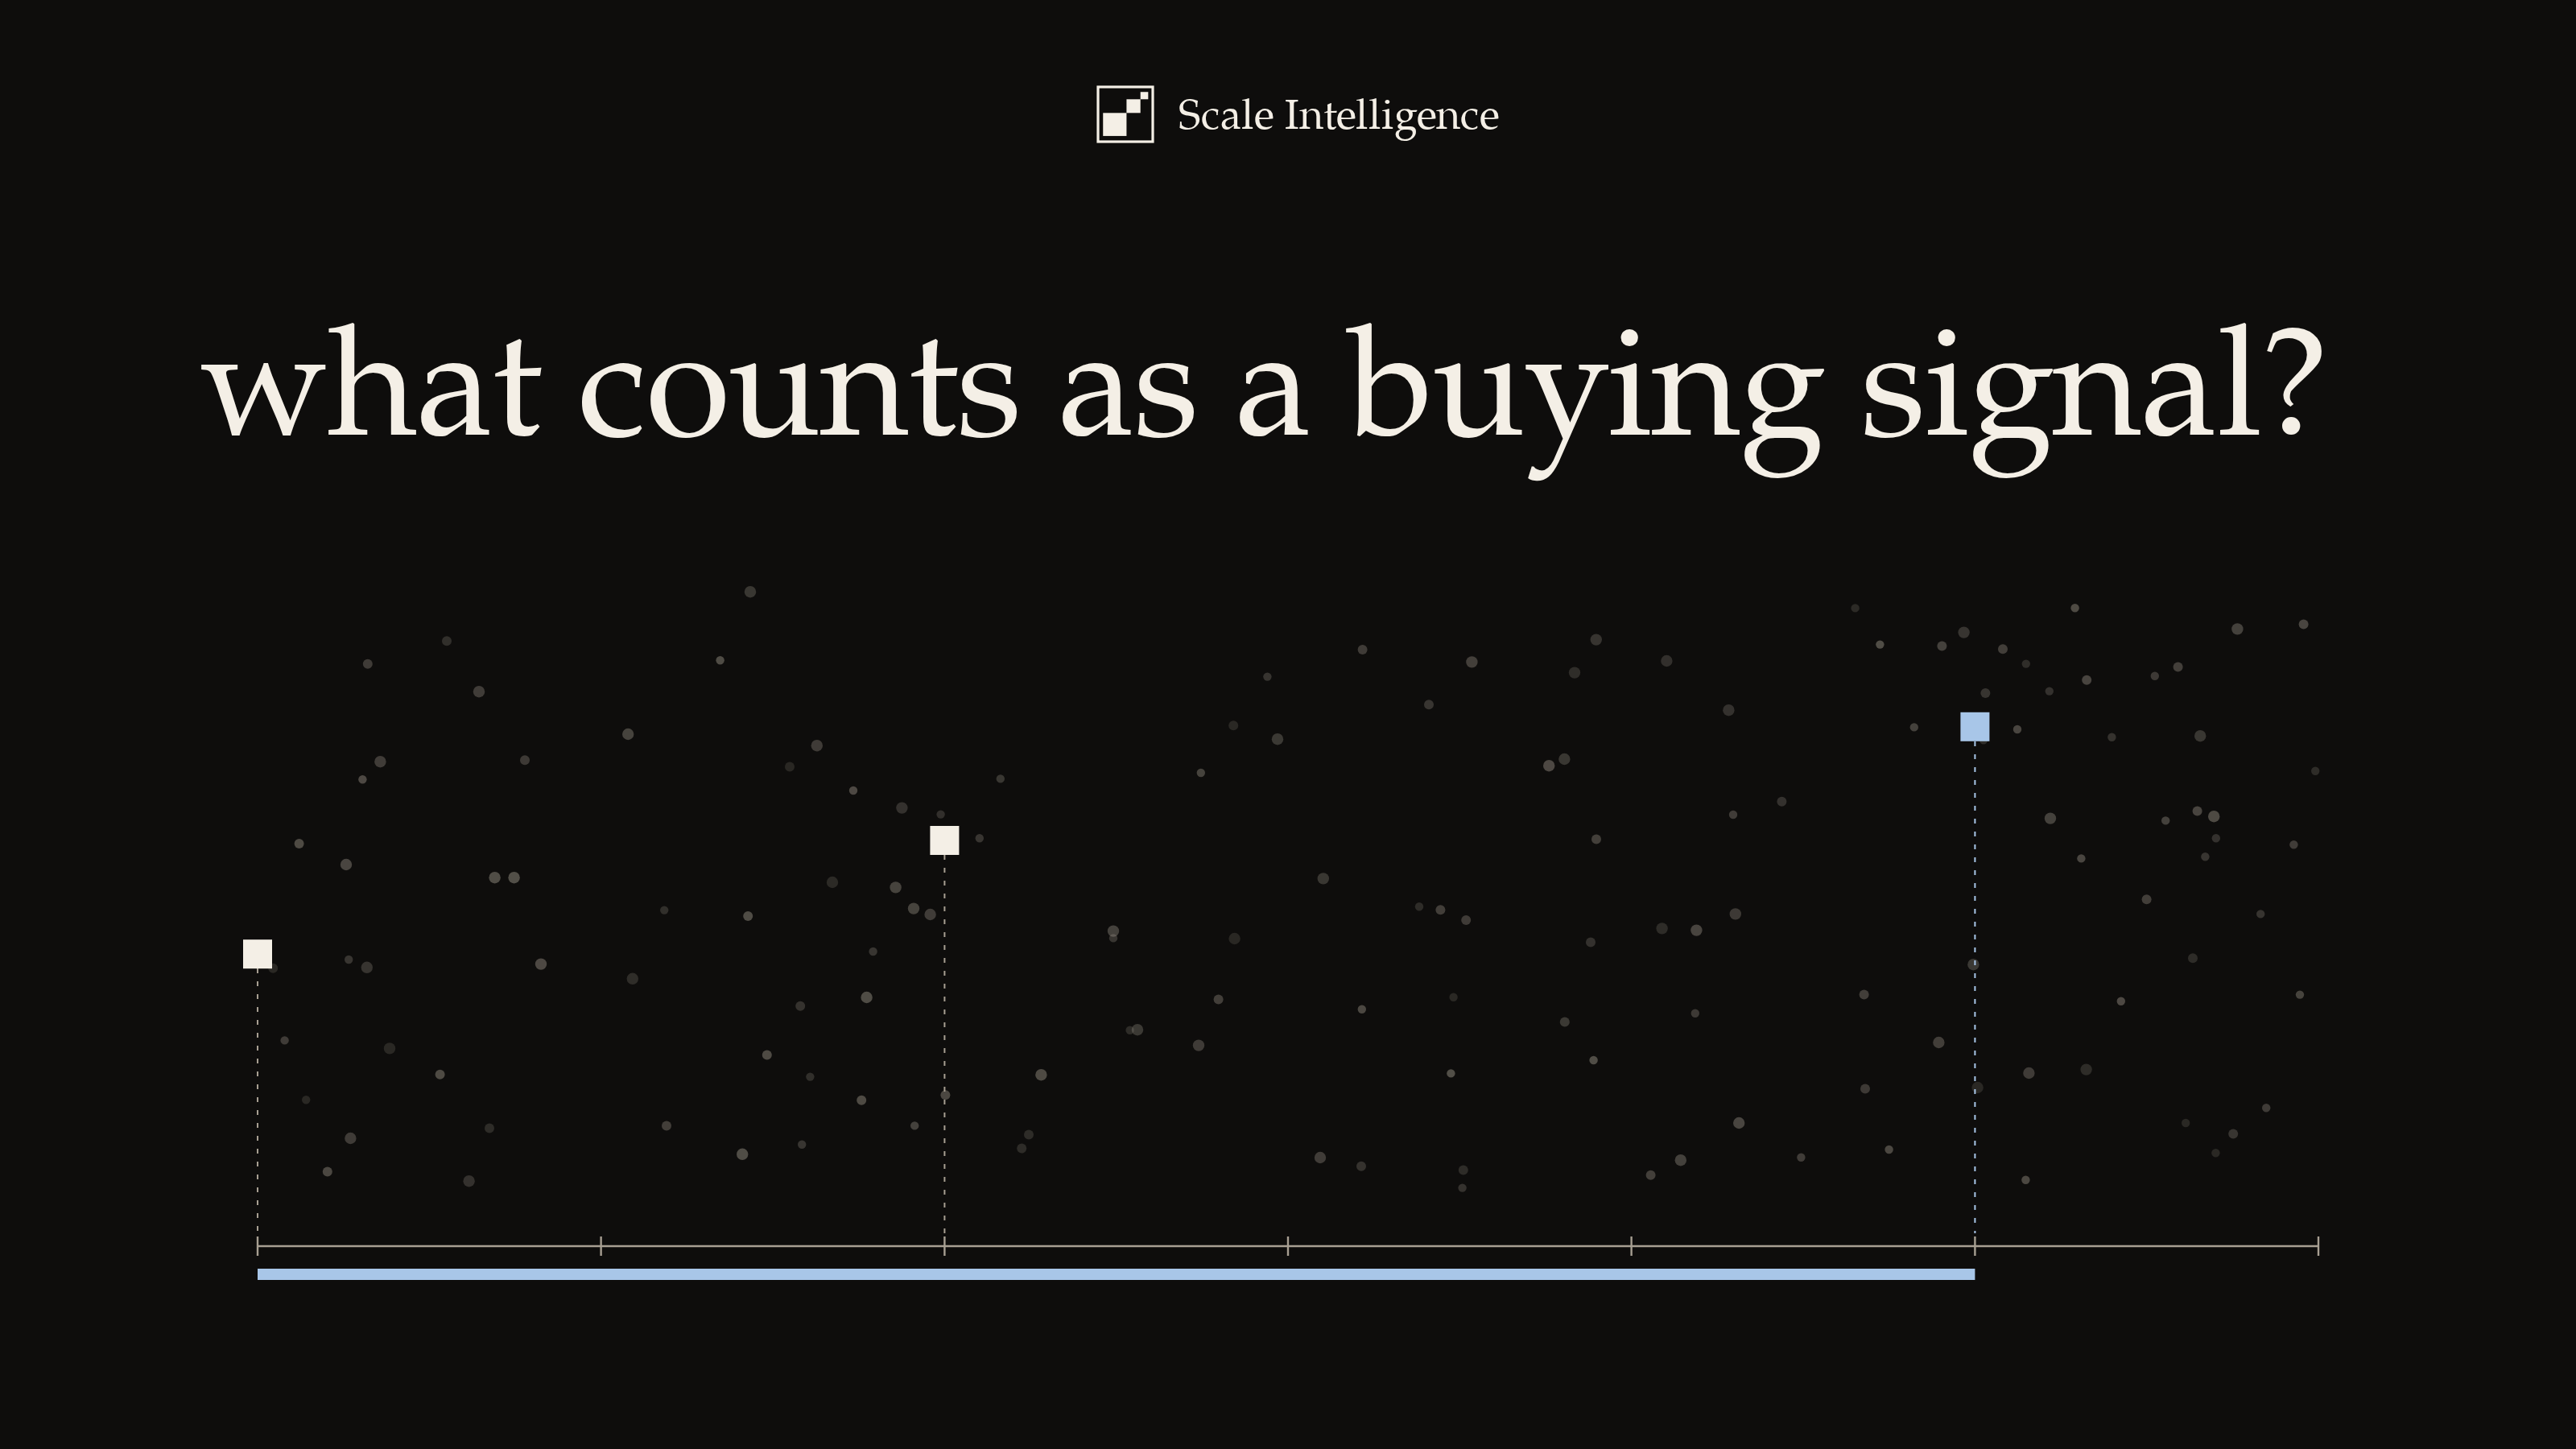
Where the alpha has been. Nine go-to-market channels and the years each one was still cheap. Blue is the window, grey is everything after the crowd arrived, and the dot is roughly where it turned. The window opens later each time and it never stays open — which is the whole argument in one picture. Two lanes are still blue at the right-hand edge; that is our read rather than a measurement.
So here is what this piece covers:
where the alpha is, meaning the four places it hides and why each of them is priced the way it is
how you find it, which is the part we call gtm algebra
how you keep it, because finding it once and compounding it are different jobs
ten analogies from trading, one per section, because that is the closest comparison I know for how gtm actually works
Everything below is one closer look at a single part of the same machine.
Figure 1. Signal to algebra to channel. Five monitors feed data into gtm algebra, which is the grid of forty cells with four of them blue, and the result is routed out to five channels. Every figure that follows is really just a closer look at one part of this machine.
How to read this
Blue is alpha, the edge nobody else has priced in yet. It only ever means that.
Grey is the market, meaning everyone else, the crowd, and the raw data.
Dashed lines are either a leader to a count, or something that was hidden or slow.
Green and red are a channel gaining or losing at the last recalculation, and they are only ever used for scores.
Alpha is not a property of a channel. It is a property of a channel at a moment, which is why the same tactic can be the best thing you own in one year and a waste of budget three years later. There are four places it tends to sit, and each of the four is priced by a different mechanism.
Every revenue channel has a period where it is underpriced, underexploited, or not yet saturated. The company that discovers that opportunity first gets an advantage.
Figure 2. Sixty-two months of a channel being adopted. The single blue bar is your entry at month ten, and the grey dots are the crowd arriving thirty-five months later, close to the top. Everything between those two points is the return you keep because you got there early.
When a competitor posts about a strategy that is working for them, they are giving away some of their alpha to attract customers. Businesses give away medium-level alpha to demonstrate that they have deeper alpha.
Figure 3. A competitor's playbook drawn as twenty-six tactics. Four are filled in, and those are the ones they post about. The other twenty-two are outlines, which are the tactics that are real, that are working, and that never get shared. The four are there to make you believe in the twenty-two.
An outbound agency sells the alpha of having done outbound before and knowing how to build, operate, and optimise the system. The value of the service is largely the knowledge gap between the provider and the customer.
Figure 4. The same starting point and the same destination. The grey walk takes twenty-eight wrong turns to get there and the blue line takes none. The provider already made those wrong turns, and that is what you are paying them for.
Service businesses are always an arbitrage of alpha. If you are an outbound agency, the tools are mostly out there already, and anyone can go and buy the same ones you use. What the client is paying for is that you know how to do this before they do. You have the alpha of what works, meaning which lists, which offers, which sequences and which channels are still underpriced, and they are paying to skip the part where they find that out for themselves. What you can charge comes down to two things, which are how much of that alpha you have and how few other people have it. The more alpha you hold and the fewer people who hold it, the higher the fee sits, and the moment that alpha becomes common the fee falls back towards the cost of the tools.
Figure 5. Three hundred agencies, three years, and the same play. In year one three of them know it and the fee sits a long way above what the tools cost. By year three all three hundred know it and the fee has fallen back to the price of the tools. Nothing about the play changed in those three years; only the number of people holding it did.
B2B data companies, signal providers, intent data, market intelligence and competitive intelligence are fundamentally selling alpha. They take information that is difficult to collect, structure, interpret, or act upon and turn it into an advantage for the buyer.
Figure 6. Forty-eight raw signals go in, fourteen are left after structuring, and three are left that you can actually act on. The pan is the product, and the forty-five it removes are most of the value.
Knowing that alpha exists in those four places does not tell you which one is paying this quarter. That is a measurement problem, and the way through it is to stop treating market information as narrative and start treating it as variables you can compare. Three steps get you there, and they have to happen in order.
The premise is simple: turn market data into variables. Buyer signals become variables. Competitor signals become variables. Market trends become variables. CRM and customer data become variables.
Figure 7. Six signal families, each of them now a listed series with a history and a direction. Three are rising and those are drawn in blue. Nothing here is a trade yet, but everything here can now become one.
Once everything is represented as variables, you can start observing the relationships between them. You can match signals against outcomes. You can identify correlations. If a particular sector of buyer signals consistently precedes new revenue, that is alpha.
Figure 8. Sixty-four periods and two series. The grey signal spikes three times, and the blue revenue spikes six periods later every time. The lag is the same at every event, and that consistency is what makes the relationship tradable.
Finding alpha is the cheaper half of this. Alpha decays the moment it is discovered, which means the value of the system is not the answer it gives you today but how quickly it gives you the next one. Three habits are what keep the edge once you have it.
Because markets are constantly changing, the system has to constantly recalculate. New signals appear. Relationships change. Channels saturate. Competitors adapt. Buyers change behaviour.
Figure 10. Six channels across twelve quarters. Two of them get cut a little every quarter, three hold where they are, and one, drawn in blue, gets loaded up a little every quarter. The budget follows the alpha.
Figure 11. This is what the recalculation actually produces. The alpha in the grid gets turned into one recipe per channel, made of leads, an offer, a sequence and an avatar, and each channel is then scored. Two are up and two are down, and the next quarter's budget follows the sign.
Channels saturate. New opportunities emerge. The alpha moves. The advantage comes from how quickly you can identify where the alpha is.
Figure 12. Eight seasons at two spots. At spot a the boats above the waterline go from one to eight while the fish below it go from eight to none. At spot b one boat arrives in season seven, and the fish are still there.
The winners are the companies that can find it, act on it, and build systems around it. Gtm algebra finds the alpha. Gtm execution compounds it.
Figure 13. Twenty-four periods from one origin. The grey circles are a sequence of good trades, and the blue squares are a system that keeps making them. The gap between the two lines is what compounding buys you.
The question is where it exists, how much of it you can access, and what you can do with it.
Where
01 · find. Every channel, trend, competitor and dataset can contain it. The radar tells you which ones actually do today.
How much
02 · access. Alpha decays as it gets discovered, so how much of it you can access depends on how early you get there.
What you do
03 · compound. A single trade is a spike and a repeatable system is a curve. Execution is the difference between the two.
Gtm is the game of alpha. A new channel can contain it. A competitor can contain it. A customer conversation, a market trend, a dataset, a piece of content, all of them can contain it. The job of gtm infrastructure is not to collect more data. It is to turn data into variables, variables into relationships, relationships into predictions, and predictions into alpha.
Gtm algebra finds the alpha. Gtm execution compounds it.
The analogies are illustrative and nothing here is financial advice. The figures are schematic, so the counts shown are counts of shapes on the page rather than measured data.